Technical terms of quality management: P
P-FMEA
Pa
See Probability of acceptance.
Pp
Like Cp (but as a long-term indicator).
Ppk
Like Cpk (but as a long-term indicator).
Paired t-test
Statistical analysis in hypothesis testing (similar to the 2-sample t-test, see there). In this case, the differences between two populations are compared with regard to their mean values. This assumes that each sample value can be paired with a sample value from the other population, which means paired samples.
Example: There is a sample value 2 from population 2 for sample value 1 from population 1.
Parameter
Quantity to identify the probability distribution.
(On the basis of ISO 3534-1)
Paraphrasing
Technique in audits: the auditor repeats statements in his/her own words.
Pareto
The Italian national economist and sociologist Vilfredo Pareto (1848–1923) discovered that most of the effects are due to a few causes. The Pareto principle states that 80% of the effects result from 20% of the possible influencing factors.
Pareto analysis
On the basis of the 80 – 20 rule (Pareto Principle, named for the political economist, sociologist and statistician Vilfredo Pareto) which can be seen in many different areas: 20% of the nonconformities cause 80% of the nonconformity costs; 20% of the customers are responsible for 80% of the revenue; when solving a problem, 80% of the solution will be worked out in 20% of the time; 20% of the causes are responsible for 80% of the effects. The Pareto analysis is an investigative method that orders all of the factors that influence a situation under observation based on their relative influence. The objective is to make it possible to concentrate a detailed examination on the primary factors. Structurally, the Pareto analysis is related to the ABC analysis, which also provides a classification according to the significance of the factors.
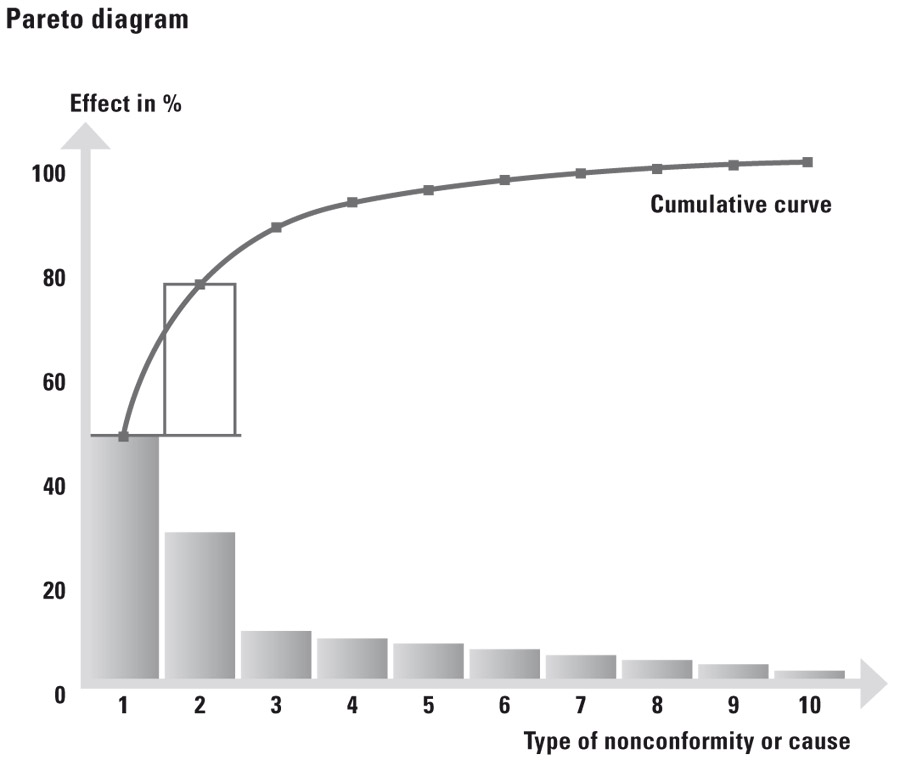
Pareto diagram
The Pareto diagram is a quality tool (Q7) and is used for nonconformity analysis. The preparation of the collected data allows a statement to be made on the significance of individual nonconformity categories. A bar diagram is drawn up for this. The bars show the values for the nonconformity categories that have been sorted according to size. A cumulative curve in the diagram indicates the point on the x-axis at which the nonconformities have reached the level of 80% of all nonconformities. The Pareto diagram is based on the 80 – 20 rule, which means that around 20% of the types of nonconformities are responsible for roughly 80% of all nonconformities.
PCA
Process capability analysis. See Process capability.
PCM
Parts Count Method: Method to determine reliability characteristics
PD
Policy Deployment. See Management by policy.
PDA
Plant Data Acquisition: General term for the acquisition of data in companies.
PDCA
PDCA cycle
Control loop according to Deming that consists of the steps
Plan – Do – Check – Act.
Plan: Defining an objective and planning the actions necessary to achieve the objective.
Do: Consequent implementation of the planned actions.
Check: Determine the extent to which the achieved result corresponds to the stipulated objective.
Act: Consequent performance of corrective actions that are needed for goal attainment and continual improvement.
The use of control loops requires that critical product or process characteristics are measureable.
Performance
Quantitatively or qualitatively measurable result; management of activities, processes, products, services, systems or organizations. (On the basis of ISO 19011:2018)
Performance audit
Examination of the performance (on the basis of characteristics), effectiveness and possibilities to improve the performance of both the management system and its individual aspects. See Audit.
Performance figure
Characteristic value that can be used to monitor and evaluate the performance of a process and for its control. Also called “performance indicator“ or “success factor“.
Remark 1: The performance figure is also often called a performance indicator or success factor.
Remark 2: The performance figure is a ratio and also represents a reference to a unit. (DGQ Volume 11-04:2009)
Performance measurement system
Performance figures (indicators) are values for measuring performances or the efficiency of processes or to determine achieved success. They are used to manage and control at all levels. The company‘s entire performance measurement system provides information about production and finances, but more importantly it covers all action areas (e.g., management, customers, employees, objective management, situations involving the environment and relevant changes). Systematic analysis of the performance figures and their correlation makes it possible to recognize if, where and when a company has to set new priorities and where there are any imbalances between fields of action.
Performance specification
Description of how the contractor is to implement the complete set of requirements from the requirement specification.
PEST analysis
Variants building on the same framework: STEP, PESTLE. Acronym for the analysis of political, economic, social, technological (and, if applicable, legal and environmental) factors making up the environment of the organization.
Pie chart
Also called a circle chart. Data are shown in a picture as pieces of a pie.

PIMS study
Profit Impact of Marketing Strategy. Tool for strategy analysis. A sector‘s profi tability can be measured with the following three categories: competitive situation, production structure and sales/ market situation. The PIMS database is based on a General Electric Group investigation conducted in the late 1960s.
Poka-yoke
This concept for avoiding unintentional mistakes originated in Japan. It indicates a principle for uncovering and preventing nonconformities by means of technical precautions. Poka-yoke concentrates on the (unintentional) errors that employees can make during production. A human error should not result in a nonconformity if possible. Example: Water connections have a right-hand thread and gas connections have a left-hand thread. This prevents a mix-up.
Policy deployment
Population
Totality of the units that are being considered. (On the basis of DIN 55350-14:1985)
Portfolio analysis
Portfolio analysis is a management tool (M7) for evaluating the data recorded in a matrix diagram. The acquired data set is reduced to a few numbers and then entered into axes of coordinates. This representation allows a qualitative comparison of two characteristic features. The result is a transparent representation of large quantities of data.
PPAP
Production Part Approval Process. Product release procedure for a component in the automotive (supplier) industry.
ppb
Parts per billion: stands for the number 10-9.
PPC system
Production planning and control system. Computer program to support users during production planning and control, as well as with data administration.
ppm
Parts per million; stands for the number 10-6.
Predictive maintenance
Approach for the evaluation of the condition of equipment by performing periodic or continuous monitoring to predict when maintenance should be performed. (On the basis of IATF 16949:2016)
Preliminary audit
Audit that is used for the preliminary evaluation and clarification of open questions in order to demonstrate the quality management system. Possible weaknesses can be detected and corrected on time, before the (certification) audit. The preliminary audit can be conducted at the request of the client.
Prevention costs
Costs that arise due to the analysis and elimination of nonconformity causes. The costs for preventive and corrective actions are also included under prevention costs for nonconformities. (On the basis of DIN 55350-11).
Preventive action
Action for the permanent remedy of the cause of a potential nonconformity or other possible unwanted situation. There are often several causes for a nonconformity. A preventive action is used to avert the occurrence of a nonconformity while a corrective action is meant to prevent the nonconformity from happening again. (On the basis of ISO 9000:2015)
Preventive maintenance
Planned activities as the result of production process development in order to correct failure causes in systems and to prevent unscheduled interruptions in production. (On the basis of IATF 16949:2016)
Principle of quality management
You can find out more about this in the Quality management principles.
Probability
P = number of favorable cases divided by the number of possible cases.
Probability distribution
Distribution of a variate. (DGQ Volume 11-04:2009)
Probability mass function
Function giving the probability that a random variable assumes a given value. (On the basis of ISO 3534-1)
Probability net
Form for graphically representing probability distributions in order to simplify their analysis.
(DGQ Volume 11-04:2009)
Probability of acceptance
Value that indicates the probability that an inspection lot will be accepted on the basis of a single sampling instruction. The higher an inspection lot‘s quality level, the greater the probability of acceptance. In statistics, the abbreviated designation for the probability of acceptance is “Pa“. (On the basis of ISO 3534-2)
Probability of rejection
Probability that an inspection lot will be rejected on the basis of a single sampling instruction.
Problem decision program chart (PDPC)
The problem decision program chart is a management tool (M7). It is used to plan actions for unexpected problems during the implementation of sub-steps. Potential faults are registered ahead of time and suitable actions are defined. The problem decision program chart has a structure based on a tree diagram. It requires that the sub-steps be analyzed in the logical and chronological order.
Procedure
A specified way to carry out an activity or process. Procedures do not always have to be documented. However the standard includes obligations to document certain procedures. They are often called “written“ procedures or “documented“ procedures. The document that describes a procedure can be called a “procedure document“. (On the basis of ISO 9000:2015)
Procedure audit
Tool to confirm the usefulness or effectiveness of stipulated procedures and approaches and also the compliance with procedures. It concentrates on examining the manner in which a particular process step is carried out. See Audit.
Procedure document
Document that contains a procedure. This document describes or presents the manner in which a process or activity should be carried out.
Procedure instruction
Instruction that describes a documented procedure. See also: Procedure document.
Process
Activities that are interrelated or interacting and that transform inputs into results. Inputs to a processare usually the results of other processes. Processes in an organization are usually planned and carried out under controlled conditions with the objective of adding value. One feature of a special process is that the conformity of the resulting product cannot be readily or economically verified. (On the basis of ISO 9000:2015)
Process approach
Understanding and awareness of an organization’s need to align its processes based on interacting process chains across functions rather than merely departmentally. Enterprises need to focus on the organization of processes instead of on their organizational structure. You can find out more about this in the Quality management principles.
Process audit
Tool for examining processes. The objective is to examine an entire process or the operating sequences that follow one another either chronological or causally with the respective procedure for possible weaknesses. See Audit.
Process capability
Suitability of a process to fulfill certain quality requirements or process targets.
Process capability analysis
Process costs
Costs caused by a process or a process step. The process costs include both the directly attributable costs and the overhead costs.
Process FMEA
See Failure Mode and Effects Analysis.
Process inspection
In-process inspection of an activity or process using the characteristics of the activity or process.
Remark 1: The process inspection on the occasion of a trial performance of an activity or process during the planning of this activity or process is also called the “trial process inspection.“
(DGQ Volume 11-04:2009)
Process management
In a narrower sense, this is the cross-functional planning, organization and control of the individual management and work activities in the company or organization. Process management is responsible for smooth-running process flows where a division of labor based on departments, as is often the case in larger companies, can easily lead to a lack of knowledge about the overall situation. In a broader sense, process management means the methodically structured analysis of the company‘s current and future requirements as well as the development and implementation of strategies to achieve a target state.
Process map (road map)
Document in which a company or organization‘s relationships, hierarchies and process flows are shown. As a rule, it describes structures and processes and additionally provides a graphical representation (diagrams, network cards).
Process model
Transparent depiction of the value chain as well as the process and activities. A process model should fulfill the following criteria: Applicability in the company; clear system depiction; basis for the integration of multiple systems (e.g., quality management, environmental management); depiction of the connections to customers and other interested parties; basis for continual improvement. Above all, the process model that is selected must correspond to the sequences in the particular company.
Process organization
Structuring and maintaining all of an organization‘s processes and sequences. Process organization regulates the time and place of the processing of all activities, as well as their interdependencies. Process organization is responsible for arranging the resources (space, time, materials, people) in the company in an expedient manner and distributing them in such a way that the tasks can be optimally performed. Together, the structural organization and process organization form the company organization.
Process owner
Process manager who is responsible for a process in the management system. In addition to coordinating the process, this includes the responsibility for the process results and the continual improvement of the process.
Process performance transparency
Measurement, evaluation and visualization of the process performance on the basis of performance indicators. The objective is to promote the continual improvement process on the basis of the indicators.
Process step
Activity or action as a part of a process.
Process structure transparency
Clearly presented representation of processes and their structure. The process structure includes the hierarchical representation of the processes, their sequence and their relationships to one another. Process road maps are often used to show the structure. See Process map (road map).
Process team
Process owners deploy process teams that carry out the following assignments: Continual improvement of the process; ensuring that the customer requirements are fulfilled; solution of current problems; determination of process performance figures; development of the process flow; and definition of the work steps. The objective is to integrate the employees with the help of the process team and to increase motivation through co-determination.
Process visualization
Graphical representation of a process.
Process-based costing
Also called activity-based costing (ABC). User-based distribution of overhead costs to the performances (reference value is the performance or the process). Tool to analyze and control overhead costs. The result makes it possible to show the relationship between resources and products in terms of economic performance.
Processed material
ProdHaftG
Produkthaftungsgesetz (German Product Liability Act). Law from December 15, 1989. In Germany it regulates a manufacturer‘s liability for nonconforming products and aims at improving consumer protection by introducing liability that is not dependent on negligence or fault.
Product
Result of a process. A product can be divided into four generic categories:
- Services (e.g., transport)
- Software (e.g., computer program, dictionary)
- Hardware (e.g., mechanical engine part)
- Processed materials (e.g., lubricant).
Many products consist of elements from various generic product categories. The dominant element determines whether the product is called a service, software, hardware or processed material. For example, a car (in the sense of an offered product) comprises hardware (e.g., the tires), processed materials (e.g., fuel, coolant), software (e.g., engine control software, operating manual) and service (e.g., the dealer‘s explanations of correct operation).
A service constitutes the result of at least one activity that is necessarily performed at the interface between the supplier and customer. The following activities can be part of the provision of a service:
- an activity carried out on a tangible product that the customer supplies (e.g., an automobile that needs to be repaired);
- an activity that is carried out on an intangible product that the customer supplies (e.g., the income statement for a tax return);
- the delivery of an intangible product (e.g., imparting knowledge);
- the creation of ambience for the customer (e.g., in hotels and restaurants).
Software is intangible. It consists of information and can be in the form of approaches, transactions or procedures. Hardware is normally tangible and its quantity is a countable characteristic. Processed materials are usually also tangible, but their quantity is a continuous characteristic. Hardware and processed materials are often called goods. (On the basis of ISO 9000:2015)
Product audit
Product-based, quality audit on a part, component or service. The product or service is tested for its compliance with customer requirements, specifications, drawings, standards and statutory provisions. A product audit is more comprehensive than a final inspection, and also tests the final inspection methods, the suitability of the sample sites, the correctness of the sample size, and the applicability of the evaluation criteria.
Product behavior inspection
Quality inspection conducted in order to obtain information about the offered product‘s behavior after delivery to the customer or client. (On the basis of DIN 55350-17)
Product category
Product liability
Manufacturer‘s liability for consequential damages resulting from the use of an offered product.
(DGQ Volume 11-04:2009)
Product specification
Specification that contains the requirements on a product.
Production
Process to manufacture products such as production materials, production or spare parts, assemblies or heat treatment, welding, painting, coatings or other forms of surface treatment. (On the basis of IATF 16949:2016)
Production accuracy
Qualitative term for the degree of approximation of production results to the target value of the quality characteristic being considered according to the individual requirement in question in the framework of the quality requirement for the manufactured product.
(DGQ Volume 11-04:2009)
Production control plan
Documented description of the systems and processes that are necessary for production control. Sometimes just called “control plan“. (On the basis of IATF 16949:2016)
Production lot
Lot that originates from continual production.
(DGQ Volume 11-04:2009)
Production uncertainty
Estimated amount/estimator for the deviations of the actual values of the quantitative characteristics being considered from the reference value to identify the range of values within which a product can be manufactured in the production equipment under consideration with a properly described operating state.
(DGQ Volume 11-04:2009)
Progressive abstraction
Creativity and work technique. This technique is based on the idea that often only detailed problems are recognized, while the higher level context is lacking. This technique helps to get to the heart of a task. Systematic analysis is used to check the preliminary problem definition in order to find a new view of the problem that can then lead to more far-reaching solutions. Procedure: First the moderator describes the problem to the workgroup. In the second step, “what is really involved here?“ is asked in order to reformulate the problem and find the higher-level context. In the next step, the reformulated problem is used to look for new solutions. These steps are repeated until the maximum level of abstraction has been reached.
Project
Unique process that consists of a number of activities that are coordinated and controlled with one another and that have a starting and ending date. With consideration given to time, cost and resources, the idea is to achieve an objective that fulfills specific requirements. An individual project can also be a part of a larger project structure. In some projects, during the course of the project the objectives are refined and the product characteristics are defined according to the project progress. One or more units of products are the outcome of a project. (On the basis of ISO 9000:2015)
Project management
Concept to direct or manage (plan, monitor, control) a complex undertaking. Projects are characterized by the following features: Complex task definition with risk and a certain uniqueness; clear task definition; responsibility and objective for an overall result; time limit (start and stop date); diverse, interconnected sub-tasks; limited use of resources (project-based budget); special organization coordinated to the undertaking. Each project has a project manager and a project team.
Project operating plan
Project plan that represents the logical order to process a project‘s work packages. It also includes an estimate of the resources required to process the individual work packages.
Project planning
Systematic, target-oriented planning based on the project order. The following types of planning are typically used in project planning: Work breakdown structure, project operating plan, schedule, capacity plan, cost plan, total project costs, quality plan, and project implementation.
Prototype
Sample used to test a unit‘s development status.
Provider
An organization providing a product or service. A provider can be part of the organization or act as an external provider. “Contractor” is another term sometimes used in a contractual situation. For example, ISO 9000:2015 lists the following as providers: producer, distributor, retailer or vendor of a product or service. (On the basis of ISO 9000:2015)
PTB
Physikalisch Technische Bundesanstalt, Braunschweig und Berlin.
www.ptb.de